
IUL Index Allocations: Why the Hype Leads to Disappointing Results
- LIR TEAM

- Jul 26, 2025
- 4 min read
Updated: Jun 26

When it comes to Indexed Universal Life (IUL) insurance, the allure of high returns based on index allocations often leads consumers to overlook key risks. At LifeInsuranceReview.com (LIR), we’re dedicated to protecting consumers and providing fiduciary advice. In this article, we’ll break down why IUL cash value allocations tied to various indexes often don’t perform as promised, and why consumers need to be cautious when considering these products.
The Illusion of High Returns with Alternative Indexes
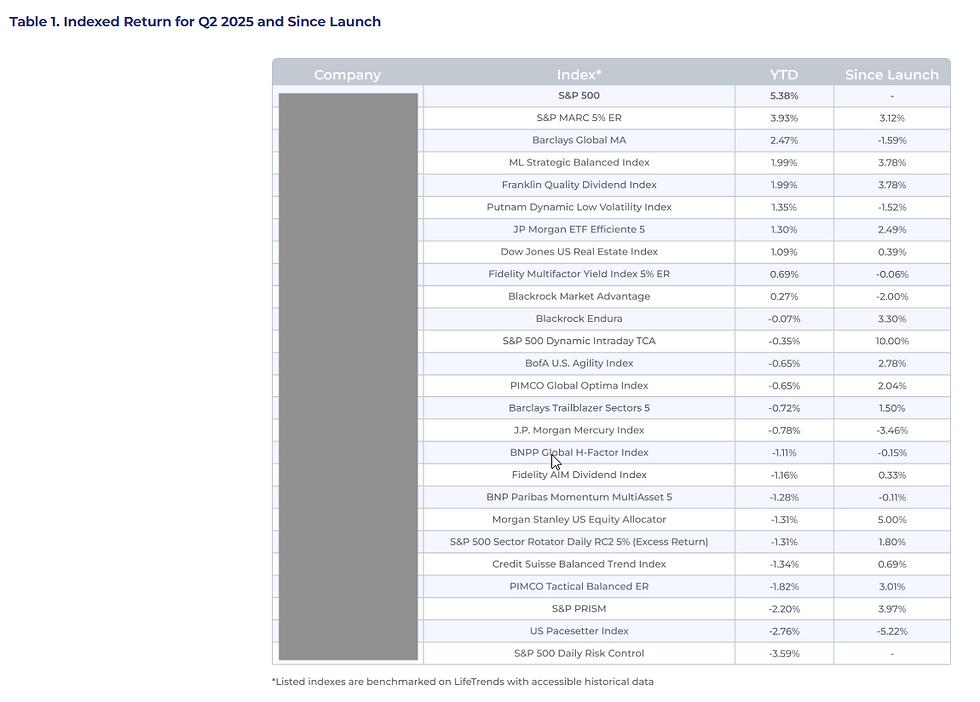
There are over 50 major indexes used by insurance companies for IUL policies, but the reality is that most of them fall short in delivering the returns you might expect. While the S&P 500 is the most commonly referenced benchmark, IULs also tie returns to a range of alternative indexes. These indexes often come with complex structures such as point-to-point tracking, participation rates, caps, and spreads.
At first glance, these alternative indexes may seem appealing, but in practice, many fail to match the performance of the S&P 500. Even the S&P 500 index, with all its variations, can offer different results based on how the return is structured, like whether it's point-to-point, capped, or spread. Unfortunately, these variations don’t always provide the gains they promise.
The Dangers of Over-Reliance on Backtesting Data
Many IUL policies are marketed based on backtested results, which can be misleading. Backtesting uses historical data to project how an index would have performed in the past, but it doesn’t necessarily reflect future performance. Consumers are often presented with carefully crafted backtesting that makes certain indexes appear more attractive than they truly are.
The truth is, the vast majority of these alternative indexes do not perform as well as their backtested data suggests. Even the top-performing indexes, as highlighted by LifeTends, underperform the S&P 500 in real-world scenarios. What sounds like a promising opportunity can often lead to disappointing returns.
Participation Rates and Caps: The Fine Print
A major feature of IULs is the participation rate, which determines how much of an index's return you’ll receive. While many IUL policies boast participation rates of 100% or more, this isn’t always as advantageous as it seems. If an index returns zero or a negative result, even a high participation rate can leave you with nothing.
For instance, many IULs offer a 250% participation rate. This sounds impressive, but if the index return is zero, you’ll still earn zero, regardless of the participation rate. It’s crucial to understand that these participation rates often don’t translate to meaningful returns if the index performance is weak or flat.

The Misleading Nature of IUL Illustrations
One of the most common issues with IULs is how they’re illustrated to consumers. Insurance agents often show projections based on the maximum allowed rate of return, typically between 6-8%. While these numbers may seem appealing, they are highly static and unrealistic.
The cap rates and participation rates used to calculate these returns are subject to change over time. In reality, they often decrease as market conditions evolve. The illustrations you see are based on ideal conditions that are unlikely to remain consistent, leading to misleading expectations about what your IUL will actually deliver.
IUL Cash Value Shortfalls: A Hidden Reality
At LifeInsuranceReview.com, we’ve reviewed hundreds of IUL policies annually and found that nearly 8 out of 10 have significant cash value shortfalls. This means that the real-world performance of the policy’s cash value is often far less than what’s promised or backtested. These shortfalls can be difficult to recover from, especially when you were led to believe the policy would perform much better.
Key Takeaways for Consumers
If you're considering an IUL, it’s crucial to look beyond the marketing hype and understand the risks involved. While index allocations offer some potential for growth, they come with a range of factors that can significantly impact your returns. The backtested data may look impressive, but real-world performance often doesn’t match up.
Work with a fiduciary professional who will prioritize your interests and help you fully understand how these policies work. Don’t fall for the hype — ensure that you are fully aware of the terms and limitations of any IUL before committing to one.
Frequently Asked Questions (FAQs) - IUL Index Allocations Why Disappointing Results
1. What is an Indexed Universal Life (IUL) policy?
An IUL is a type of life insurance that ties the policy’s cash value growth to a stock market index, such as the S&P 500. It offers a death benefit and the potential for growth, but comes with significant risks related to index performance and caps on returns.
2. Why do many IUL policies underperform?
The performance of IUL policies is often disappointing because the indexes they use don’t live up to backtested results. Additionally, participation rates and caps limit the returns, and many of these policies have terms that change over time, leading to lower-than-expected growth.
3. What is a participation rate in an IUL?
The participation rate determines how much of the index’s performance is credited to the policyholder. For example, if the participation rate is 100%, you would receive the same return as the index (up to any cap). However, if the index performs poorly, you could end up with no growth.
4. How does backtesting affect IUL performance?
Backtesting is the process of using historical data to estimate how an index would have performed in the past. While backtesting can look impressive, it doesn’t account for future market conditions, which means it often leads to overly optimistic expectations that don’t materialize in reality.
5. Should I trust IUL illustrations showing 6-8% returns?
While these illustrations may seem attractive, they often rely on unrealistic assumptions and static rates. The cap rates and participation rates are likely to decrease over time, making these projected returns misleading. It’s crucial to understand the fine print and ask about realistic expectations for your policy’s future performance.
IUL Index Allocations, Why Disappointing Results


